Edge Function 504 error response
Last edited: 8/21/2026
An internal 504 from an Edge Function means the function failed to initiate a response within 150s, the max execution time.
As of now, this limit cannot be increased. If your function always needs more time than allowed, skip to When optimization isn't enough section. Otherwise, follow the steps below to speed up response times.
Step 1: Identifying slow Functions#
You can filter for 504 events in the SQL Editor with the below query:
1select2 timestamp,3 log_attributes['request.pathname'] as pathname,4 log_attributes['response.status_code'] as status_code,5 toFloat64OrZero(log_attributes['execution_time_ms']) as execution_time_ms6from logs7where8 source = 'function_edge_logs'9 and toInt32OrZero(log_attributes['response.status_code']) = 50410order by timestamp desc11limit 20;You can further explore how much time a specific function takes on average by running the below query:
1select2 log_attributes['request.pathname'] as pathname,3 log_attributes['response.status_code'] as status_code,4 avg(toFloat64OrZero(log_attributes['execution_time_ms'])) as avg_runtime_ms,5 min(toFloat64OrZero(log_attributes['execution_time_ms'])) as min_runtime_ms,6 max(toFloat64OrZero(log_attributes['execution_time_ms'])) as max_runtime_ms7from logs8where9 source = 'function_edge_logs'10 and log_attributes['request.pathname'] = '/functions/v1/YOUR_FUNCTION_NAME' -- <---add your function name or remove filter11group by pathname, status_code12limit 20;Once candidate functions are identified, you can investigate more thoroughly.
Step 2: Investigating slow Functions#
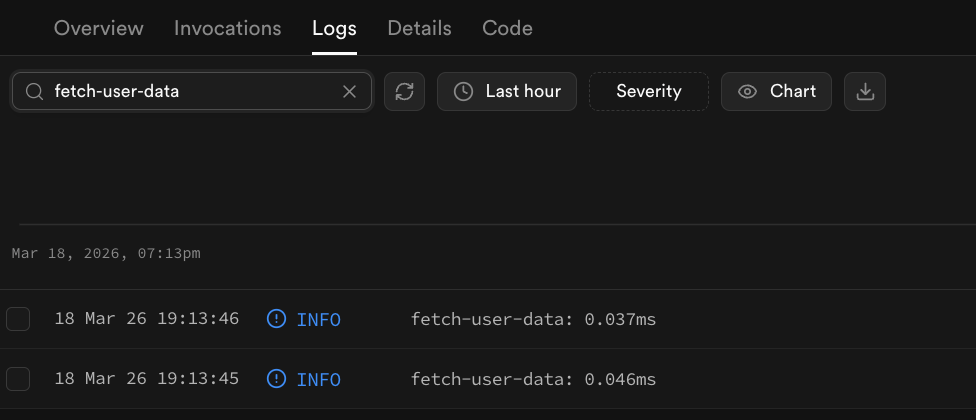
Add console.time labels around suspicious sections to pinpoint where time is being spent:
1console.time('fetch-user-data')2const userData = await fetchUserFromDatabase(id)3console.timeEnd('fetch-user-data')The time response will show up in the function's dashboard under the Log tab with the label you assigned it. You can use the label as a keyword to search for the timestamp.
For local development, you can also step through execution with Chrome Dev Tools.
Common culprits:
- Sequential API calls that could run in parallel
- Unindexed or unoptimized database queries
- External APIs that are throttling or rate-limiting you
- Loops without a clear escape condition
Step 3: Optimize#
The below suggestions are some strategies you can pursue to reduce execution times.
Parallelizing requests#
If requests are independent of one another, rather than calling them sequentially, you can speed up operations by calling them in parallel with Promise.all:
1// Before: sequential: total time = A + B2const resultA = await fetch('https://api-one.com/data')3const resultB = await fetch('https://api-two.com/data')45// After: parallel: total time = max(A, B)6const [resultA, resultB] = await Promise.all([7 fetch('https://api-one.com/data'),8 fetch('https://api-two.com/data'),9])Splitting up logic#
The Edge Function may be doing more than it needs to. It may be better to split up it's logic into multiple parts that can be called individually and run for shorter periods.
Use background tasks [utilize-background-tasks]#
You can initiate functions in a background task to be handled independently of the request/response handler. The process is outlined in the Background Task docs
Offload work to the client or an external service#
Instead of managing all operations within the function itself, there may be an external API that can execute jobs faster and then send back results. Alternatively, you may be able to offload some processing to the requester rather than doing everything within the function itself.
Using alternative libraries#
Some libraries, may be more optimal than others. It's worth exploring alternative libraries that may execute faster or are lighter weight.
Optimizing database operations#
If you are connecting to Supabase Postgres from your function, you can inspect the speed of your queries in the performance dashboard. If the operations are slow, you can review performance and index advisor for improvement suggestions.
Implement caching#
If you are making requests to the same resource and the return values change irregularly, you may be able to implement an external cache layer, such as Upstash Redis to reduce wait times.
Restrict request load#
If the function is used to evaluate user submissions, you can restrict load size to reduce computational time. You can use the below query in the SQL Editor to filter by the content size in bytes provided by the initial requester:
1select2 log_attributes['request.pathname'] as function_name,3 log_attributes['response.status_code'] as status_code,4 avg(toInt64OrZero(log_attributes['request.headers.content_length'])) as avg_content_size_in_bytes,5 min(toInt64OrZero(log_attributes['request.headers.content_length'])) as min_content_size_in_bytes,6 max(toInt64OrZero(log_attributes['request.headers.content_length'])) as max_content_size_in_bytes7from logs8where9 source = 'function_edge_logs'10 and log_attributes['request.pathname'] = '/functions/v1/induce-504'11group by function_name, status_code12limit 10;When optimization is not enough#
Edge Functions have a hard runtime ceiling that cannot be raised. If your use case genuinely requires more, consider:
- using a serverless/edge function service, such as AWS Lambda, with fewer restrictions
- Self-hosting Edge Functions and reconfiguring the runtime constraints
- refactoring your application to rely on other resources for serverside tasks, such as Next.js API routes
Still stuck?#
Here are some further resources you can review
- Review our guide on local debugging with Chrome Dev Tools
- Read the Function Error Handling guide for best practices on structuring error responses
- Check the Supabase GitHub Discussions, Discord, and Reddit page for similar reports that can help with debugging
- Open a support ticket from your Dashboard if the problem persists and you believe it is a platform issue